
How to design a graphical interface? Basic graphical objects used in HMI systems | HMI programming course. Part 4.
During the course you will learn, among others:
- Which graphic objects should you learn about (tank, tap, valve, bar graph, indicator light, pipeline)?
- How to adjust the size and appearance of graphical objects.
In the previous article in the series "How to add and edit operator screens? | HMI console programming course. Part 3"You learned how to add and configure application screens. You also learned how to create a project and run its simulation offline.
In this part of the course, you will start to develop a suitable application for the operator console, which will be extended with new features over time. This will be a program that controls the process of mixing colours from three tanks: red, green and blue.
HMI panel programming - course for automation engineers
- 1. How to create your first HMI panel project?
- 2. How to configure application settings? Interface and basic functions of the development environment.
- 3. How to add and edit operator screens?
- 4. How to design a graphical interface? Basic graphic objects used in HMI systems.
- 5. What types of variables are used in operator panels?
- 6. What are macros and how to use them in an HMI application?
- 7. How to configure alarms in operator panels?
- 8. How to create and modify recipes?
- 9. How to introduce application automation?
- 10. How to add the process file logging function? How to save data?
- 11. How to ensure communication with the PLC controller? Driver configuration.
- 12. How to limit access to the application? Operator passwords.
- 13. What additional functionalities may be useful when designing an applications?
Adding graphical elements to the app
Add a Picture Object, which can be found under the Draw > Picture tab.
Add the object to the screen and enter its settings by double-clicking with the mouse cursor (the object will be transparent as it has not yet been assigned a graphic). On the Name tab, select Select / Import from Library (middle button).
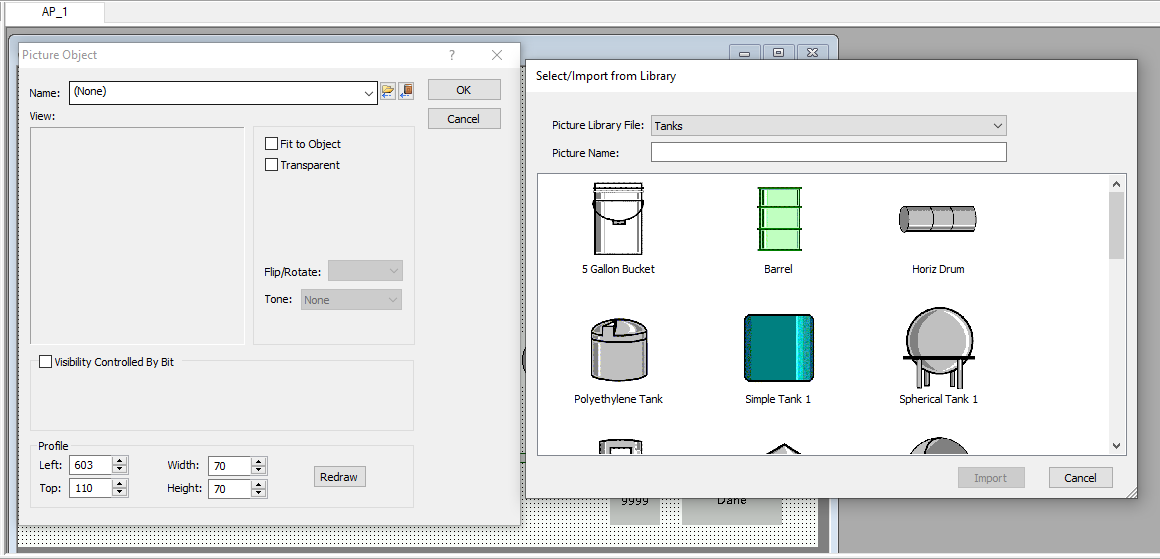
Then select Tanks from the Picture Library File menu. Select the object named Tank 6 and place it on the screen. To remove the white background, select the Transparent option. Remember to select the Fit to Object option each time, as this will cause the added graphics to remain at their original size by default and you will not be able to fit them to the window.
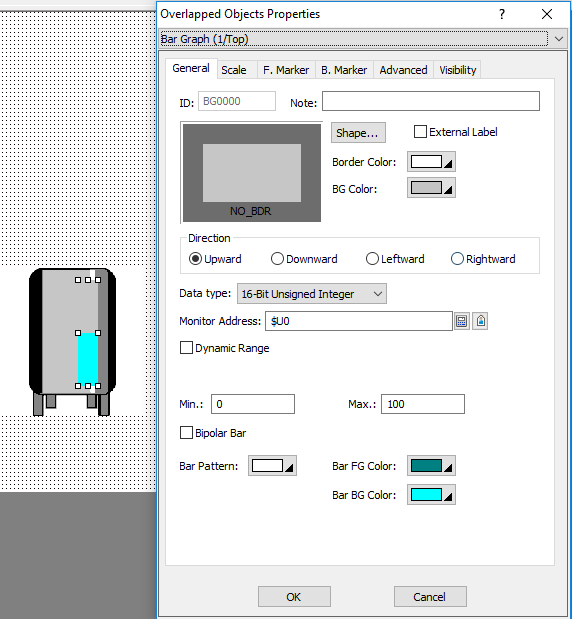
Then select the bar chart from the top menu, which you will find in Object > Graph / Chart > Bar Graph. Place it on the tank and set the parameters. This will visualise the level of material in the tank. Configure the parameters of the object as below:
Note the drop-down menu at the top, which allows you to select which object you want to control at the moment. Then add an object to the screen whose type is Picture Object.
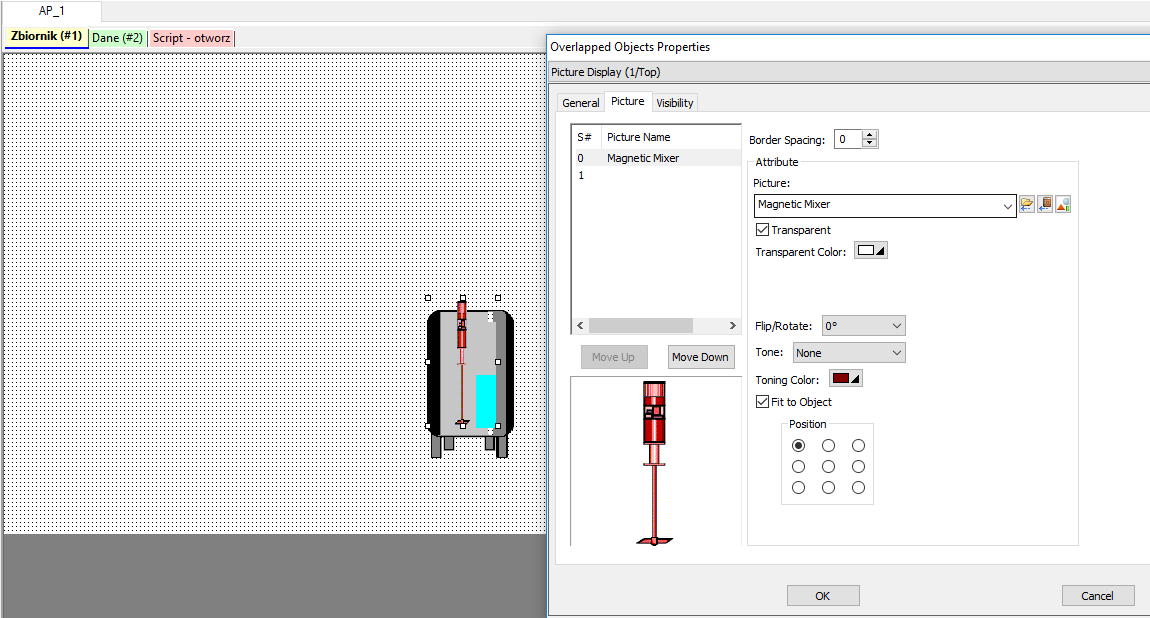
Access the Graphical Objects library again and select the Mixers group, then select Magnetic Mixer. As in the previous step, adjust the size and appearance of the object.
Now add a beacon to the container by selecting Object > Bit Lamp from the top menu.
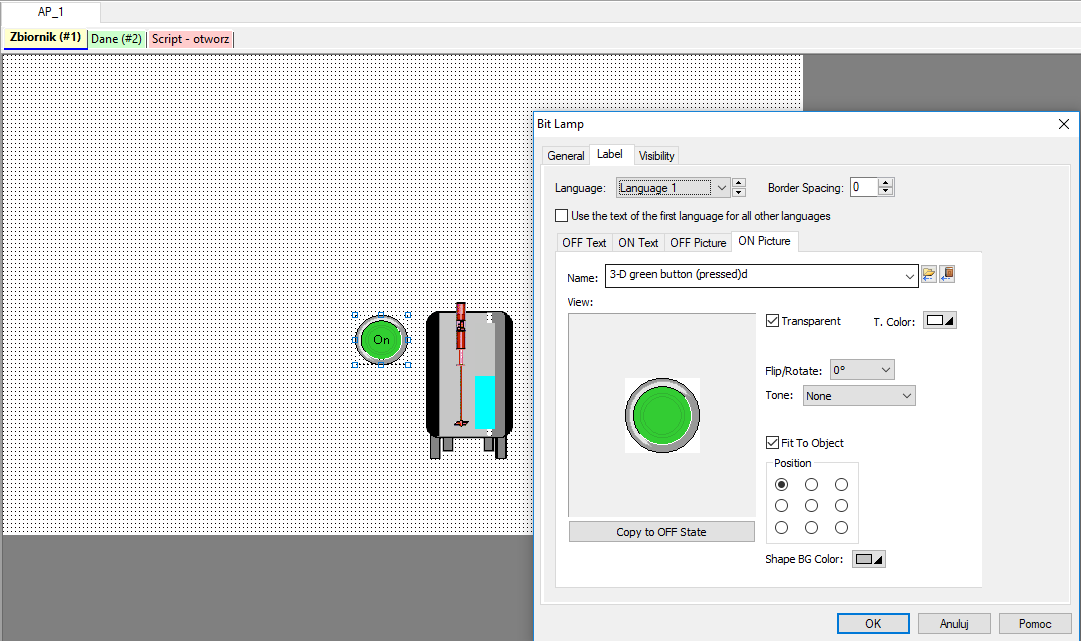
Then, on the Label tab, assign the corresponding graphic to the states ON Picture and OFF Picutre. You will find them in the same library as before in the 3D Pushbuttons folder. Remember the Transparent and Fit To Object functions.
Now add another graphical object similar to the tank, which can be found under the Tanks1 tab. Place it in the top left corner of the screen.
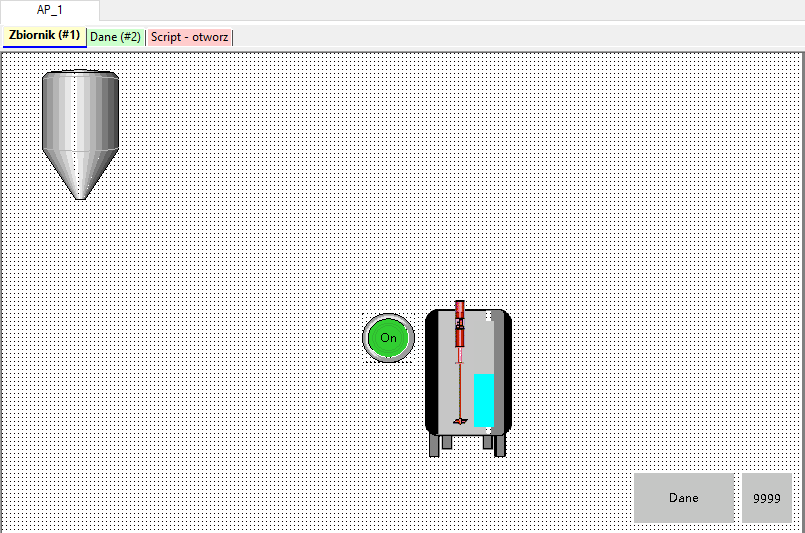
Adjust the size and settings of the imported graphics and insert the text field in the new container by selecting Draw > Text from the top menu. Double-click on the text box and, by changing the parameters of the displayed text, adjust them so that the description looks as shown in the image below.
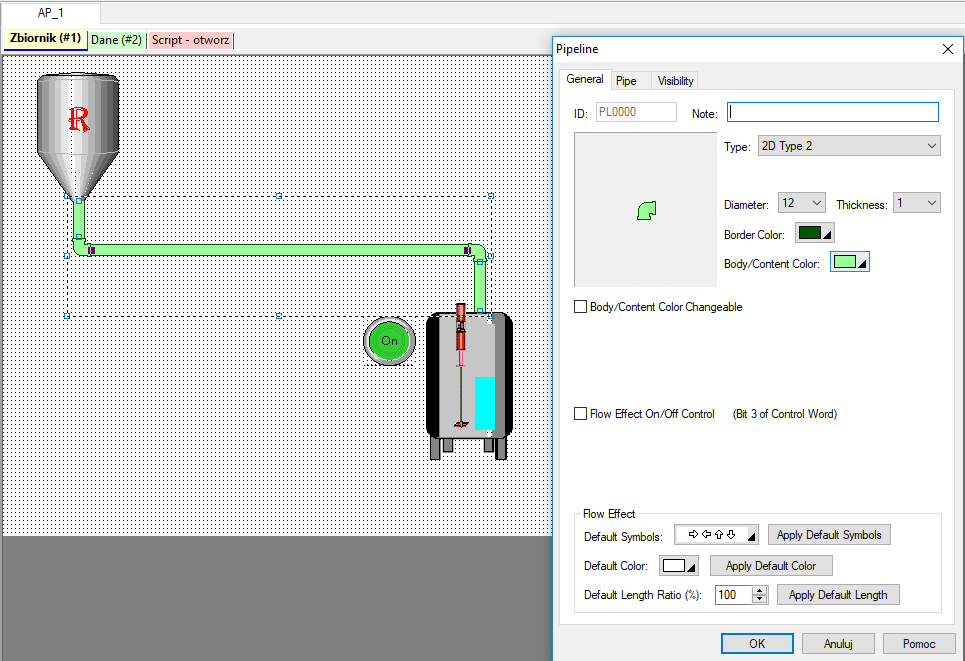
Now use the Pipeline option in the Object tab of the top menu. Use it to draw the pipeline that will connect the tank to the container and set its parameters. Similarly, draw a second pipeline from the bottom of the container to the right side of the screen as a drain.
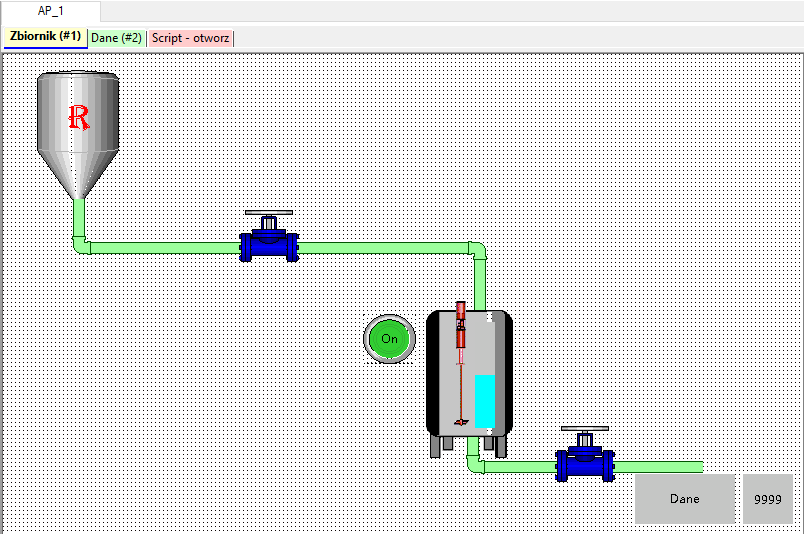
In the next step, add the valve graph as before using the Picture Display function. Start with the graphic parameters, i.e. choose two different graphics for the two object states, selecting objects from the library as before: Hand valve - horizontal and Hand valve 2.
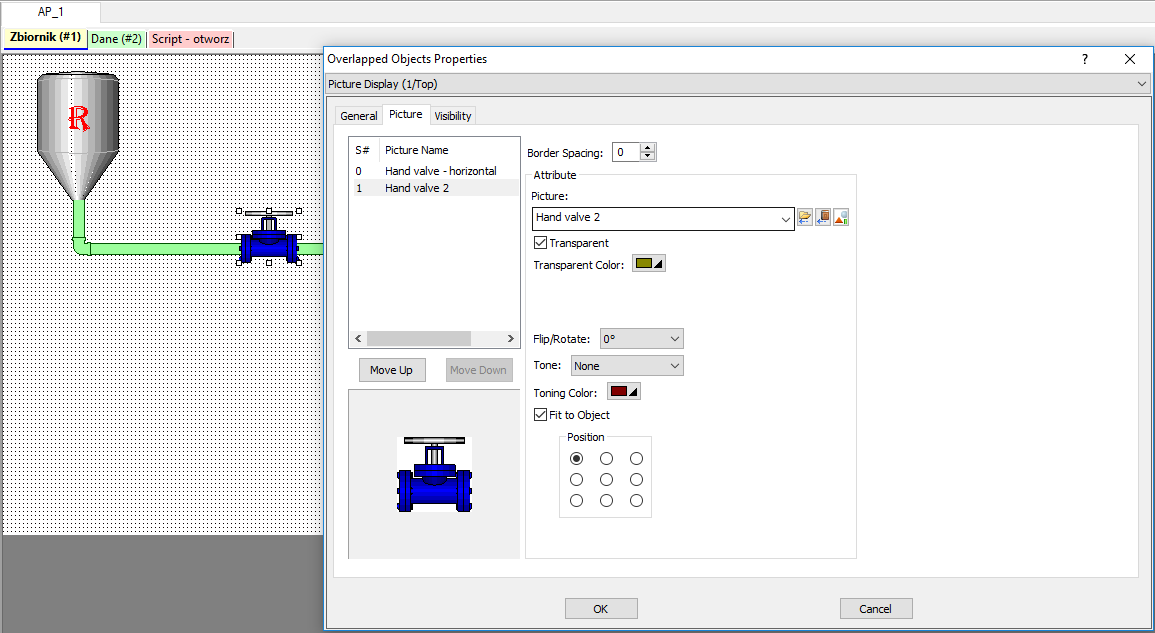
Then, on the General tab, assign the monitored variable $U10.1 depending on which graphic (first or second) will be displayed.
Once the valve is configured, exit its settings, copy it (default Ctrl+C) and paste the copy on the second set of pipes coming from the bottom of the container.
Go to the settings and change the monitored value only to $U10.2, then confirm your changes.
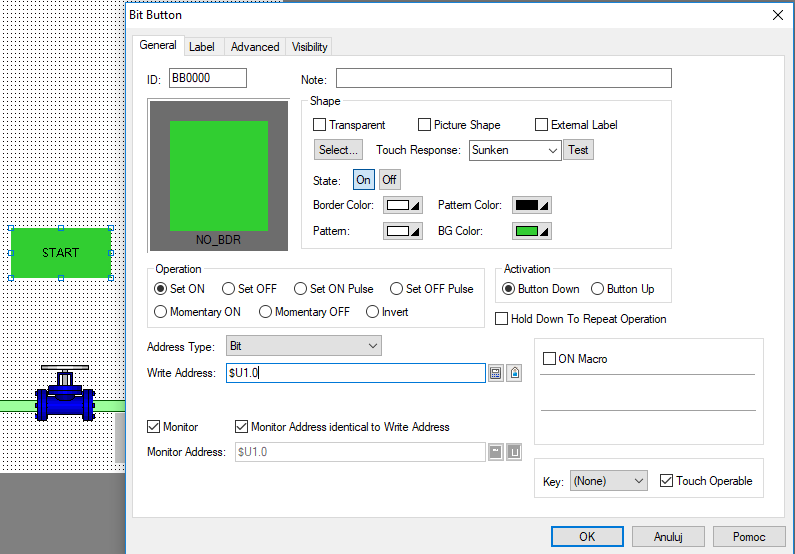
Once the valves have been added and configured, add a button that will be responsible for the execution of the application. Do this using a Bit Button, assigning it the variable $U1.0 and the corresponding graph and labels for the high and low states. Remember that you can change the label in the Label tab and you can assign graphical items in the General tab.
To make sure you haven't forgotten anything, compile the program.
Now go to the Data screen. Insert the Numeric Display object into it and assign the Monitoring Address as $U0 in its settings. Then check the External Label option at the top of the window and select the new tab corresponding to this option.
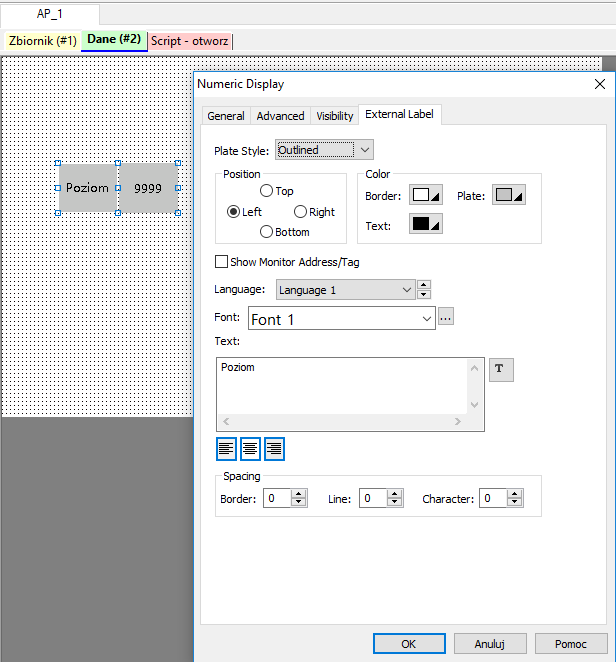
Enter Level in the Text field. The displayed value will simulate the liquid level in the main tank.
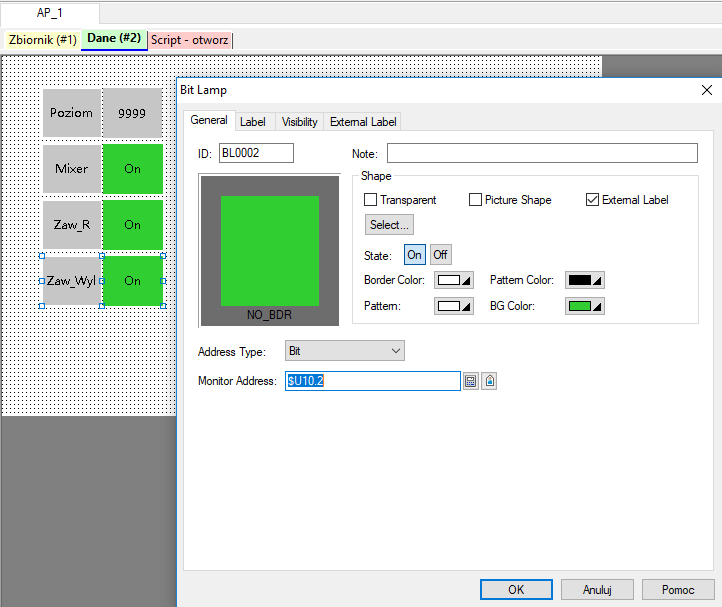
In a similar way, add three Bit Lamps and assign the bits $U10.0, $U10.1 and $U10.2 in sequence.
Offline testing of the software in a running simulator
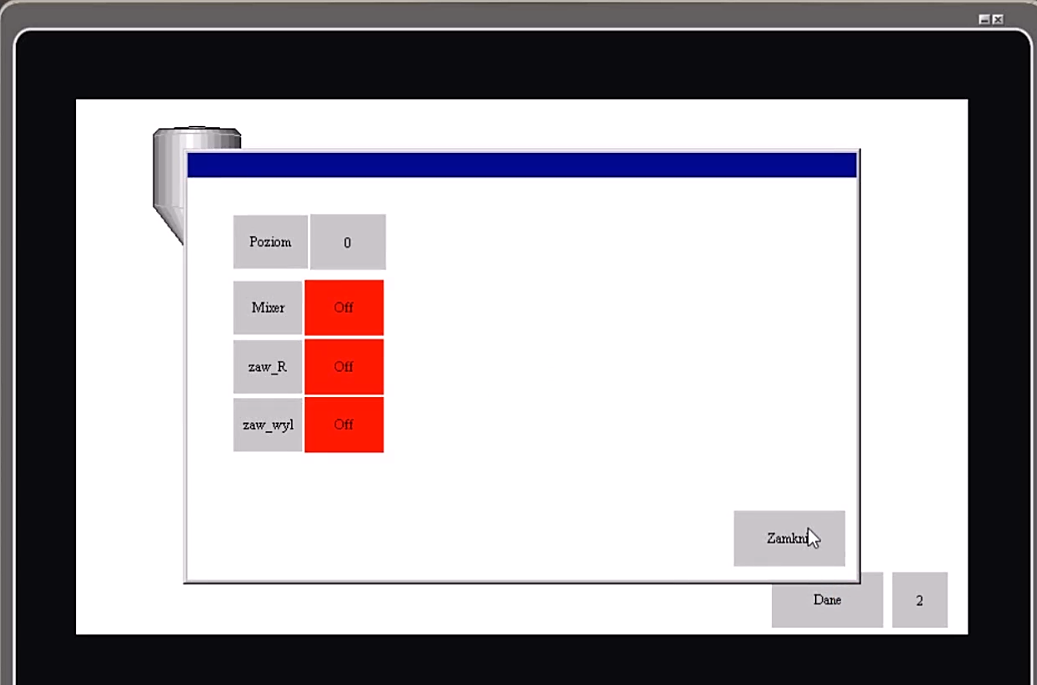
Save, compile and test the app in an offline simulator to check that the features you have added work properly.
After running the program, you should see all three bits of light (red and OFF) working, and the level value should be 0, as shown below.
In the next part of the course "What types of variables are used in operator panels? | HMI console programming course. Part 5" you will learn:
- What are variables and what are they for,
- What types of variables are present in the operator consoles,
- How to assign names to variables used in the application.
Authors:
Paweł Podsiadło
Ewelina Niziołek
