
How to add process file logging function? Recording data | HMI programming course. Part 10.
During the course you will learn, among others:
- what is the data recording mechanism used for,
- how to add and use the Data Logger functionality in the application,
- how to add a table and graph of historical data.
Your HMI panel application is gaining more and more functions. You have defined its operation with macros, enabled you to select from previously saved operating modes (procedures) and in the previous episode "How to introduce automation of the application's operation? | HMI programming course episode 9" you have entered schedules.
In this episode, you will add a function that will allow you to record process data (the so-called Data Logger), create a table representing historical data on the panel, draw the data on a chart and save the whole thing to a file.
HMI panel programming - course for automation engineers
- 1. How to create your first HMI panel project?
- 2. How to configure application settings? Interface and basic functions of the development environment.
- 3. How to add and edit operator screens?
- 4. How to design a graphical interface? Basic graphic objects used in HMI systems.
- 5. What types of variables are used in operator panels?
- 6. What are macros and how to use them in an HMI application?
- 7. How to configure alarms in operator panels?
- 8. How to create and modify recipes?
- 9. How to introduce application automation?
- 10. How to add the process file logging function? How to save data?
- 11. How to ensure communication with the PLC controller? Driver configuration.
- 12. How to limit access to the application? Operator passwords.
- 13. What additional functionalities may be useful when designing an applications?
How to add data logging functionality?
In the project tree (Project Manager) on the left, find the Data Logger item and after selecting the option, right-click and select Add Data Logger.
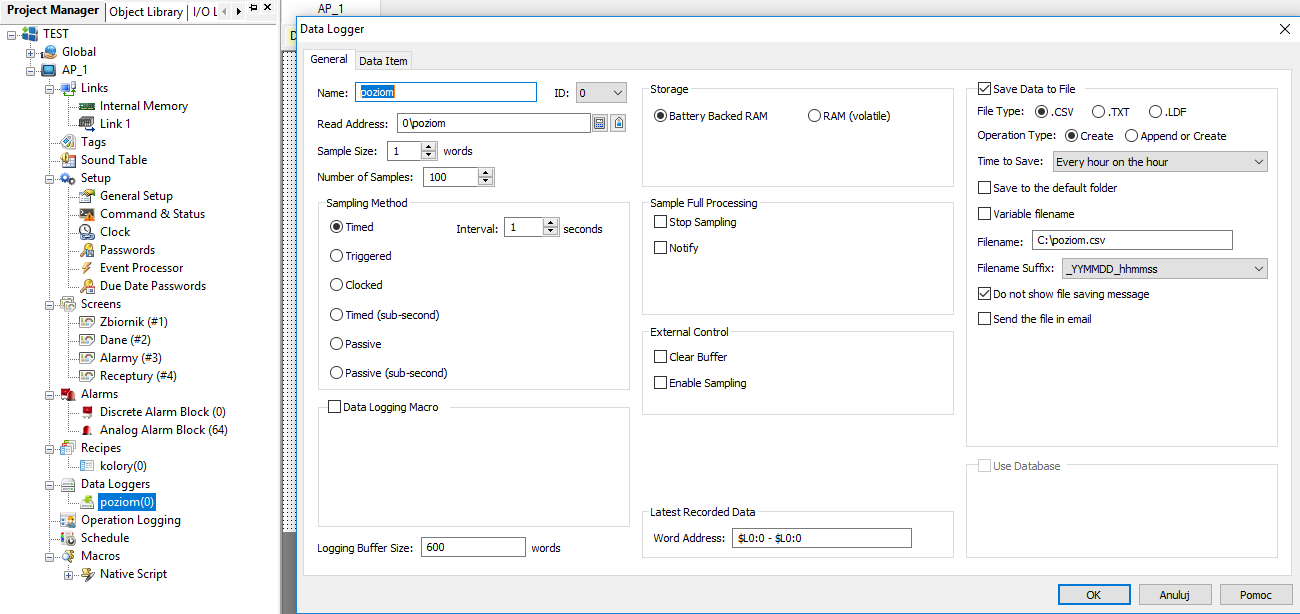
You can enter level as the name as below. Assign the monitored variable a level (tag select button) and set the Number of Samples value to 100, which will affect the sampling rate when saving data.
Select the Save Data to File option found on the right side of the window. It will allow you to save the data to a separate file, where it will be stored in the desired format.
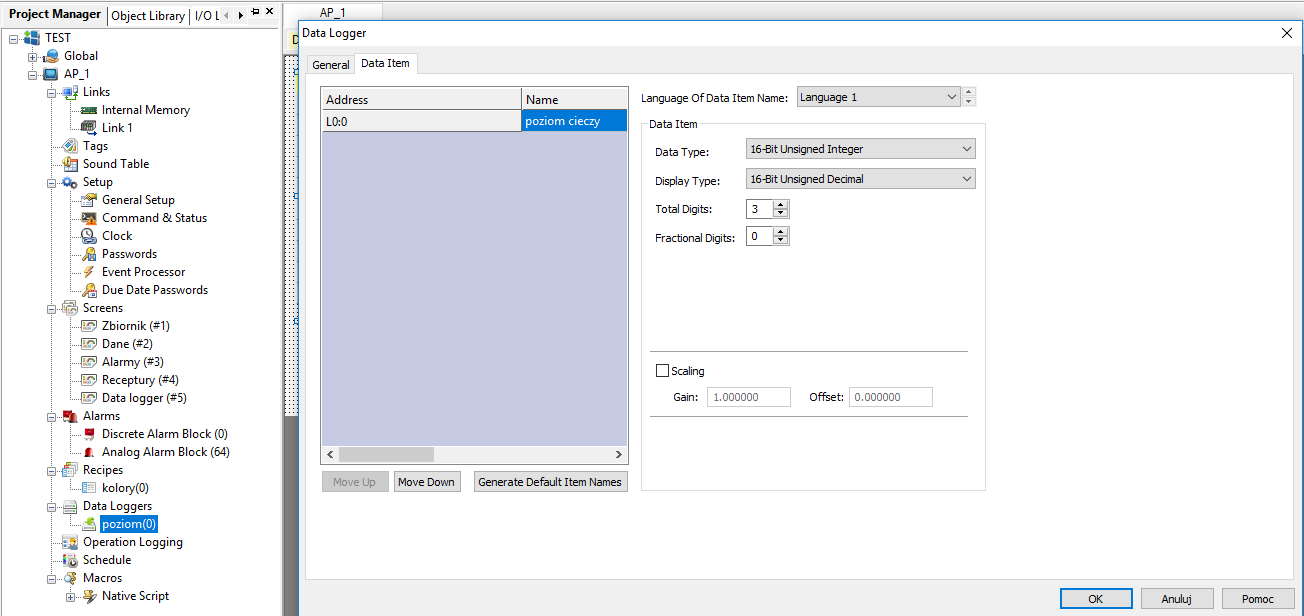
Go to the Data Item tab. In the table, in the Name field, enter the name that will be displayed next to the saved registers both in the table and on the chart. Name it Liquid Level and change the assigned number of displayed digits to 3 (Total Digits option).
Add and configure a new DATA LOGGER screen similar to previous episodes.
How to add and edit operator screens? | HMI panel programming course, episode 3
Adding a data logging table
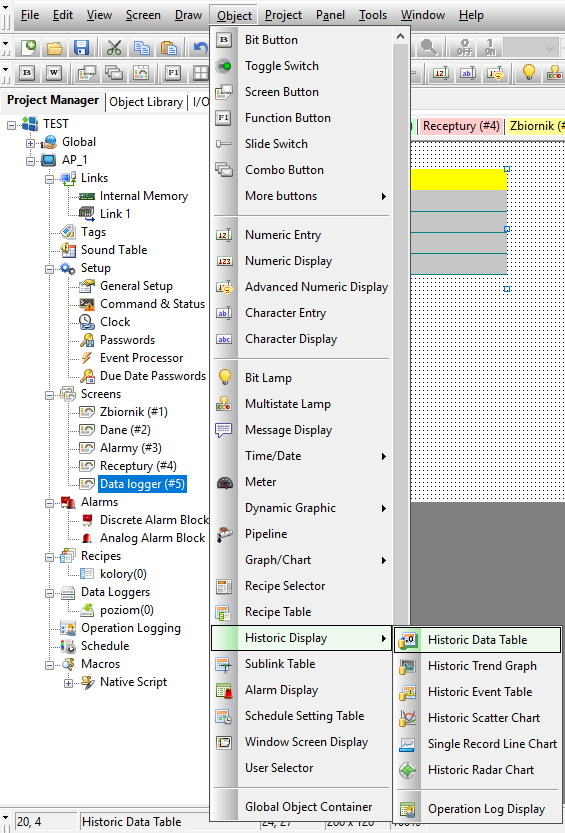
From the Object menu, expand Historic Display and select the Historic Data Table object. Place it on the left side of the newly created screen.
Enter the object configuration by double-clicking on it.
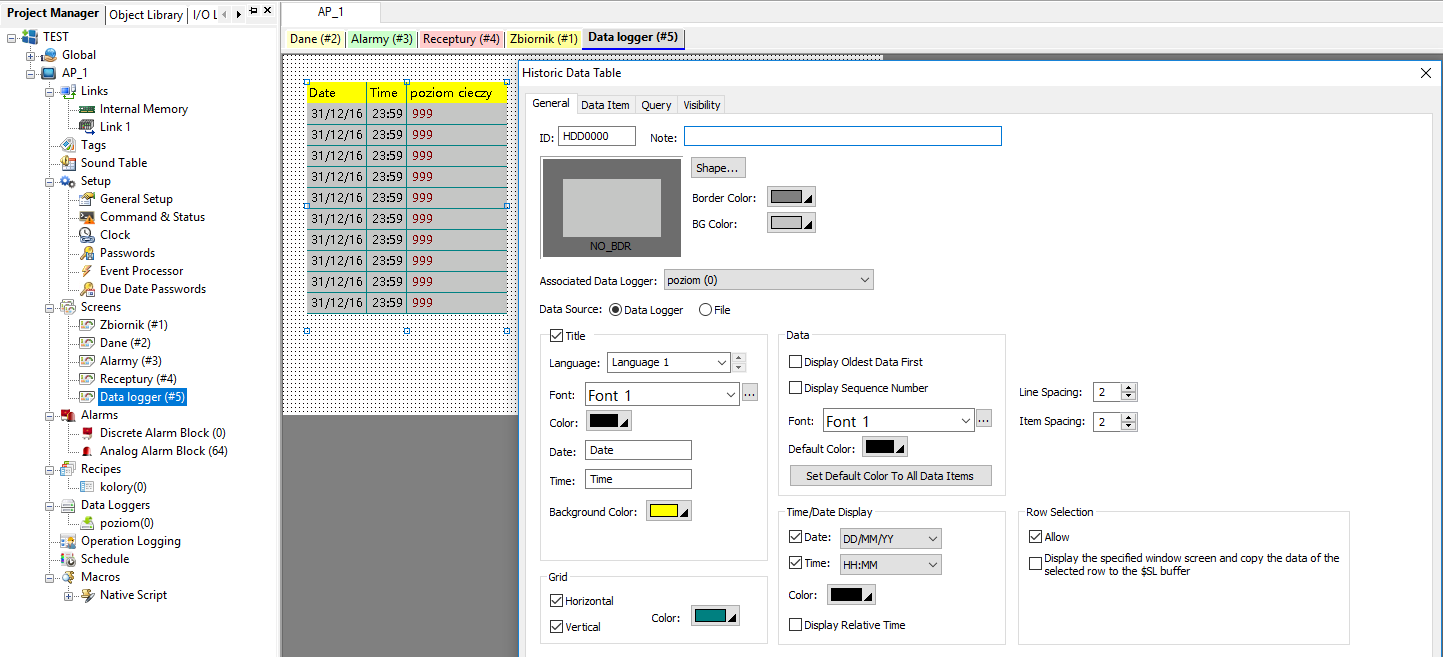
In the Associated Data Logger field, select the previously created log called level and adjust the dimensions of the new object.
As in the earlier stages of application design, add a Scroll Bar object from the Objects menu (expand More Buttons) and configure it to scroll through the elements of the Data Logger table.
Add a chart of historical data
Use the Object menu again, go to the Historic Display drop-down tab, and then select Historic Trend Graph. Enter its configuration.
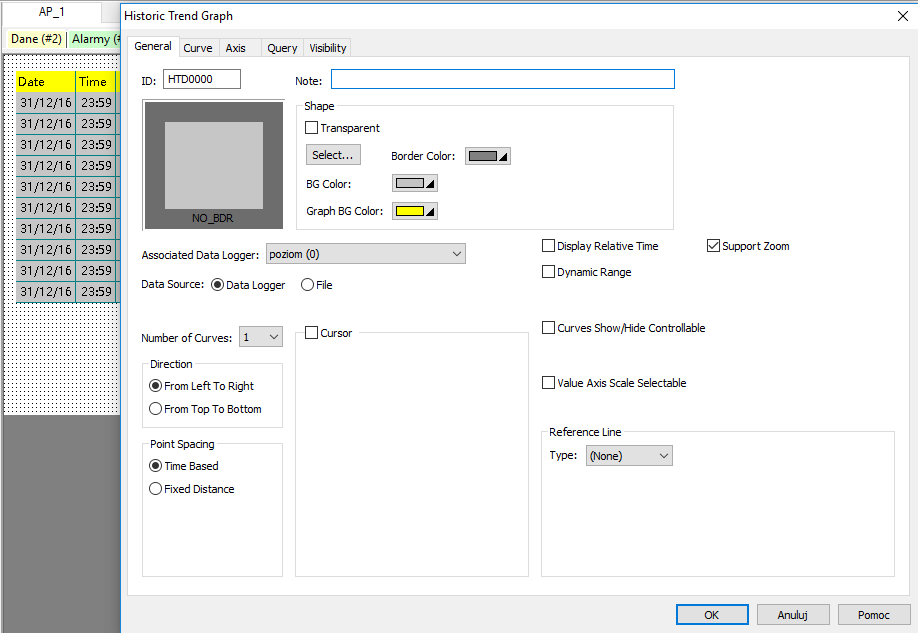
In the General tab of the object, assign it the function of monitoring the level variable. On the right side of the window, select the Support Zoom option, thanks to which you will be able to zoom in on a certain range of the chart.
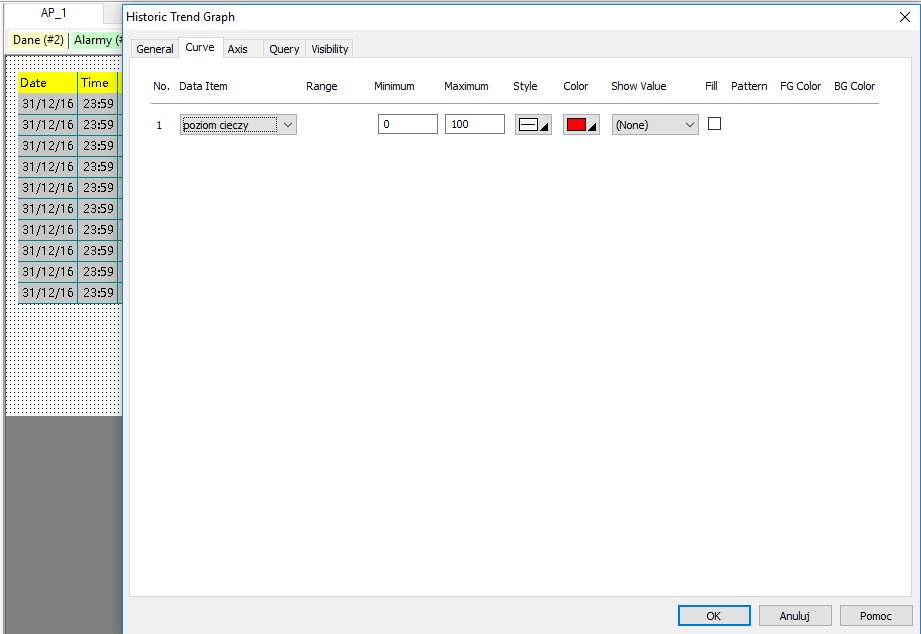
Then in the Curve tab you will see that by default a recorded variable called liquid level has been added. To increase the readability of the chart, you can change its colour. Adjust the range of the displayed variable value. To make the graph readable, set the upper range (Maximum) to 100.
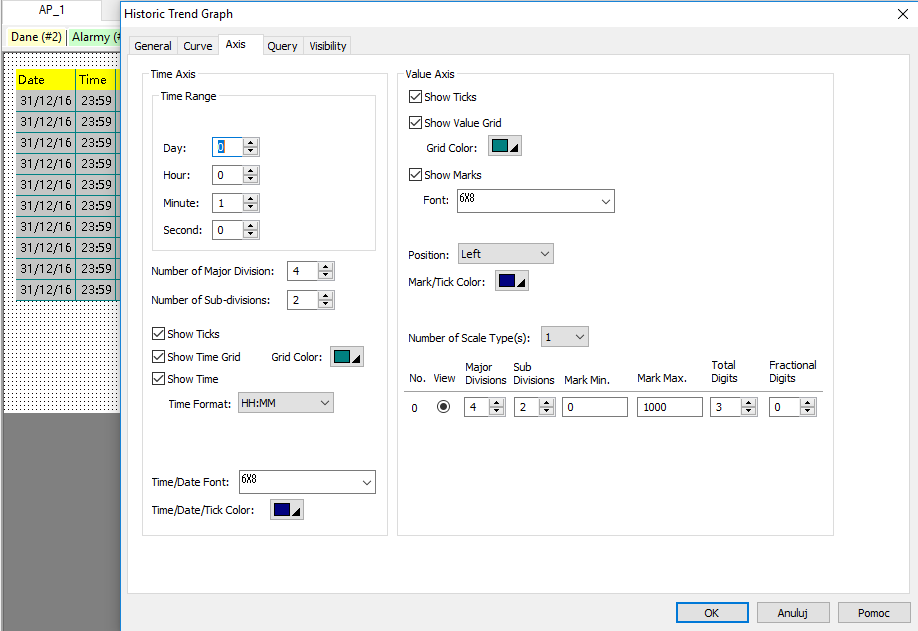
In the Axis tab, set the time range in which the monitored variable will be displayed on the graph (Day:0, Hour:0, Minute:1, Second:0) and change the precision of the displayed values on the axes on the right side of the window (Total Digits:3, Fractional Digits:0).
Click OK to close the chart configuration window, and then adjust its size and position. Add the Scroll Bar object again below the chart and configure it so that you can use it to control the displayed range of data on the chart. Notice that you have a choice of two objects that you can control using the Scroll Bar element. Select the one marked HTD.
Testing Data Logger functionality in an offline simulator.
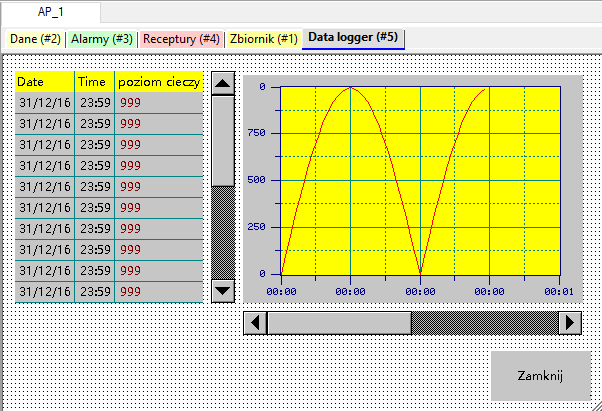
If everything has been added and configured correctly, in the Data Logger window, after starting the program with the START button, you should observe the recording of the liquid level value both in the table and on the graph.
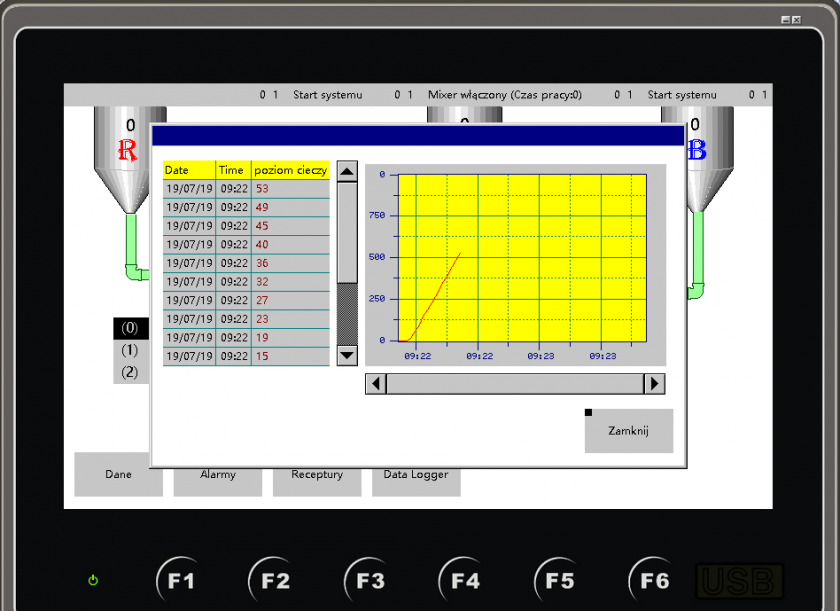
Wait until more values appear on the chart and check that all sliding bars are working as they should.
In this episode you learned how to collect historical data and display it on a chart or table. In the next episode of the series, you will learn how to use and configure drivers for communication between the panel and the PLC controller.
In the next part of the course "How to ensure communication with the PLC controller? Driver configuration | HMI panel programming course episode 11" you will learn:
- what communication protocols are available in Astraada HMI panels,
- how to configure panel communication with other devices,
- how to communicate between the HMI panel and the PLC using the Modbus TCP protocol.
Authors:
Ewelina Szędzioł
