How to calculate the profitability of purchasing a robot?
For an automation investment to bring real benefits in business terms, it must be profitable. We show how – even before the purchase – to verify whether this will actually be the case.
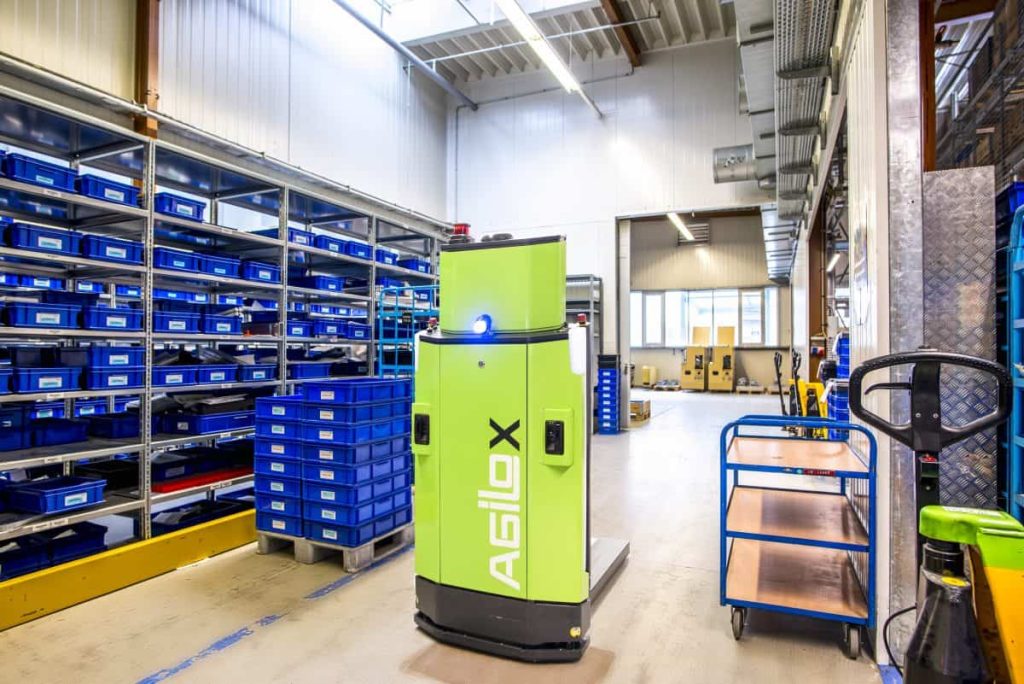
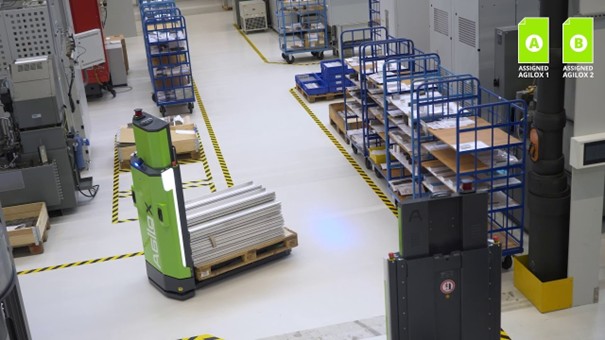
Let us present the issue of calculating profitability using the example of an investment in an autonomous mobile robot Agilox with a maximum payload of 1,000 kg, implemented in a factory producing parts for the automotive industry.
An autonomous mobile robot is typically a robot that either replaces a person pulling carts with production materials or tools to production lines, or replaces a traditional forklift that transports finished products on pallets from production lines to the finished goods warehouse (FGW).
The main purpose of a transport robot is to move goods from point A to point B within the factory and warehouse area. Its autonomy lies in the fact that it moves along a route independently, which it has previously learned. During programming, the robot should travel along the route and, using laser scanners (lidars), build a digital map that is later described by the robot programmer. Lidar is a technology used, for example, in autonomous cars. When the map is already stored in the robot’s memory, the machine receives travel orders from point to point and executes them independently. This means that it selects the fastest route itself and is able to avoid obstacles along the way (this is what distinguishes it from classic AGVs (Automated Guided Vehicles), which always follow a fixed route and are not able to deal with obstacles).
In the described example, the purpose of the implemented robot was to transport finished products packed on pallets from production to storage locations in the warehouse.
How to Calculate Whether Such an Investment Pays Off?
Let us consider where the main benefits for the company lie:
- reduction in the number of forklift operators in the logistics process (so-called FTE, Full-Time Equivalent),
- reduction of the rental costs of a traditional forklift,
- optionally: reduction of recruitment costs for operators related to high turnover at the position,
- optionally: a modern image of the plant after launching robots.
Investment expenditures will be allocated to:
- purchase of the robot and additional equipment (charger, additional devices),
- robot commissioning,
- training and preparation of engineers and personnel,
- a communication campaign related to the use of new technology cooperating with people (e.g., a competition for the name of the robot/robots),
- preparation of network infrastructure (Wi-Fi),
- optionally: hiring an engineer/automation specialist responsible for programming and operating the robot,
- maintenance of the application (in this case annual expenditures for maintaining the application must be anticipated due to its expected longer lifetime – e.g., 5 years).
The total expenditures were estimated at the level of:
- Investment expenditures: 800,000 PLN
- Operational expenditures (in subsequent years after launch): 80,000 PLN per year
- Assumed period of robot use in the selected production space: 4 years
- Launch period: 2 months
Let us move on to estimating the financial benefits of the project.
For this we need the following data:
- production system (number of shifts and number of days per week): 3 shifts / 5 days
- average production time per week: 3 × 8 hours × 5 days = 120 hours
- number of working weeks per year: 42
- number of full-time forklift operators in the area: 3
- total operator compensation (including employer costs, training, insurance, benefits, and recruitment): 9,000 PLN per month
- absence rate: 10% (included when calculating FTE)
- total monthly cost of renting and maintaining a forklift: 2,860 PLN net per month
Additional parameters:
- cost of capital: 8%
The benefits will be as follows:
- reduction in FTE: 3.0 × (1 − 10%) × 9,000 × 12 = 360,000 PLN per year
- reduction of forklift rental costs: 12 × 2,860 = 34,320 PLN per year
Total benefits amount to: 394,320 PLN per year
In the table, I compare the total benefits and the total expenditures for this project. As can be seen, its implementation may be challenging, because in the initial period (period 0) it is necessary to invest 800,000 PLN and additionally 80,000 PLN annually for maintenance (we will subtract this amount from benefits in each period from 1 to 4), while the annual benefits are less than one-third of this amount. This means that the payback period of the investment is at least 3 years.
Let us go further. We assumed that our cost of capital is 8%, meaning this would be our minimum expected return on this investment (compared with a bank deposit). Additionally, we will introduce the concept of cash flow, meaning we will calculate how much money in a given period the investment takes from or adds to the company (the sum of expenditures, which take negative values, and benefits, which are recorded as positive values). In the next step we will also calculate how much future cash flows will be worth today, taking into account the cost of capital. For this we will use a simple formula:
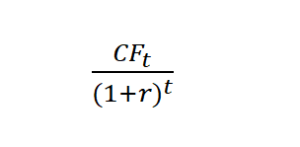
CF = flow in a given period
r = expected rate of return per period (usually a year) (in our case the cost of capital)
t = the number of the period for which we calculate the discounted flow (the initial period is 0)
For this example:
Discounted cash flow in period 0 (initial period, in which we have the main investment expenditures): –800,000 / (1 + 8%) ^ 0 = –800,000 / 1 = –800,000
We show this only as an example, because initial expenditures are usually not discounted, but rather the value of expenditures is directly transferred to the sum of flows.
Discounted cash flow in period 1: 314,320 / (1 + 8%) ^ 1 = 314,320 / 1.08 = 291,037
Discounted cash flow in period 4: 314,320 / (1 + 8%) ^ 4 = 231,034
And these calculations are the most difficult ones we have to perform when calculating investment profitability.
What Does This Mean?
If we expect an 8% return on capital (our cost of capital), then 314,320 PLN in one year has a present value of 291,037 PLN today. And 314,320 PLN in four years has a present value today of 231,034 PLN.
Graphical presentation of the method of calculating discounted cash flows:
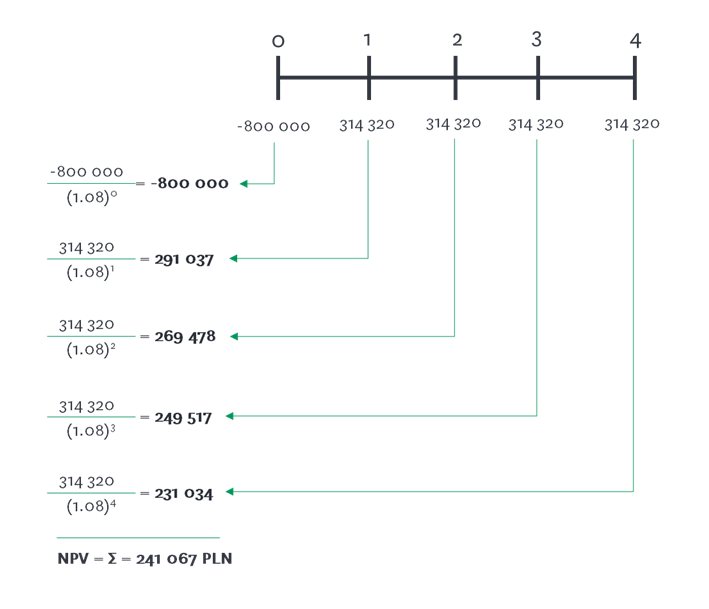
Source: Own elaboration.
At this point we start to worry even more about the profitability of this investment…
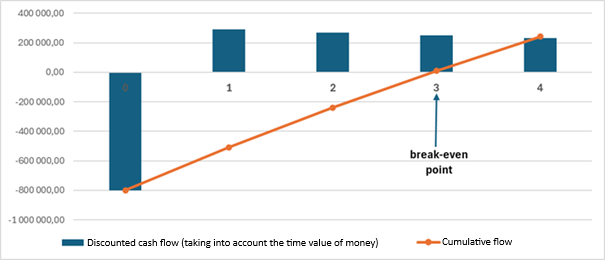
To calculate whether after 4 years we have benefits from the investment, we sum all annual discounted cash flows. This gives us the Cumulated Cash Flow. The period (year) in which it has a positive value indicates the moment at which we achieve the return (the so-called break-even point).
What Are the Final Parameters?
- Discounted Payback Period (DPP) is 36 months.
This means that based on cash flows the payback period is exactly 3 years. This is also visible in the chart presenting the cumulative cash flow and the moment when it crosses the horizontal axis and rises above 0.
- Internal Rate of Return (IRR) is 12%
Any IRR value greater than the cost of capital is a positive value and means that the investment generates additional return above the expected value (here the cost of capital).
We have a ready function for this in Microsoft Excel = IRR (flow in period 0,… flow in period n)
- Net Present Value (NPV) of the investment is 241,067 PLN
Any NPV > 0 means that the investment generates a surplus of financial benefits (cash flows). The value of this surplus is calculated taking into account the time value of money.
For NPV we also have a ready function in Excel, but when using it one must be careful, i.e. sum in the following way:
NPV = value of flow in period 0 (negative value) + NPV (cost of capital; annual discounted flow in period 1: annual discounted flow in period n)
- Another simpler way is to directly take the value of the cumulative flow from the last period of the investment (in our case period 4), which will be the value: 241,067 PLN
In this way we have calculated the three most important indicators from the perspective of the financial director who is to grant us funding for this investment: DPP, NPV, IRR. Well done! I hope that from today they will no longer seem so scary…
Detailed calculations are presented in the table.
Calculation of investment profitability indicators:
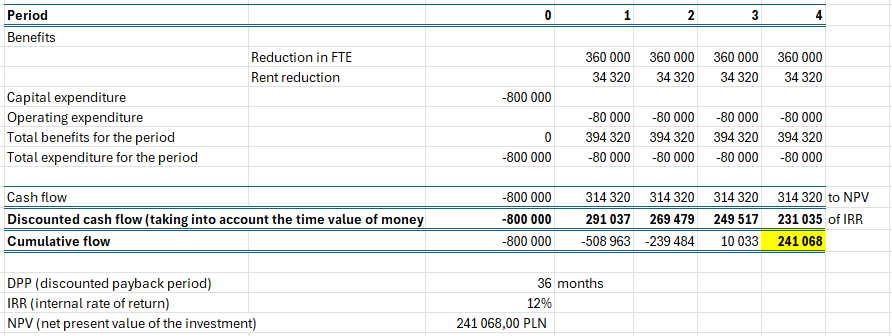
Source: Own elaboration.
Visually, the investment is presented in the figure.
Graphical presentation of financial flows and the moment of investment return (break-even point).
Source: Own elaboration.
We can introduce an inflation indicator into the analysis, which will apply both to forklift rental costs and the expected increase in wages, and index the benefits in each subsequent period by these parameters. This will increase both benefits and maintenance costs in subsequent periods. However, due to the largest investment expenditure occurring in the initial period (period 0), it will positively affect the parameters.
An additional element useful in the calculation may be the absence rate at a given position. This means the average percentage of absences. 10% means that we need to ensure at least 10% reserve in the FTE parameter. This is exactly what we did in our example. As can be expected, this additionally increases the value of benefits and improves the investment parameters.
That is all.
For the most advanced cases, where we use a hybrid intralogistics system, the calculation is definitely more difficult. In such situations it is best to use a simulation tool for the entire production process and product flow between warehouses (e.g. FlexSim) and examine the resulting parameters of the transport system, such as maximum throughput depending on the scale of production, the number of mobile robots, or the architecture of the transport system.
Summary
A precise profitability analysis of an investment in autonomous mobile robots makes it possible to assess the real impact on the efficiency of logistics processes, but also to justify a business decision before it is implemented. The example of purchasing an Agilox robot in a company producing car parts shows that with proper preparation and taking into account all costs and benefits, automation can bring a measurable return on investment within a reasonable time. The key importance here lies in the reliable calculation of the DPP, NPV, and IRR indicators and awareness of the factors influencing cash flows, which makes profitability analysis not only a control tool but also strategic support in the development of a modern, competitive factory.
The above article was created based on a fragment of the book by Jarosław Gracel “How to Turn a Technology Project into Business Success”, MT Biznes, 2025.